Green Hydrogen is considered key to a sustainable and climate neutral energy supply. Neither its production nor its consumption emits carbon dioxide, it can be stored and transported without significant losses and allows for sector coupling. However, these benefits com at a cost. For 2019, statista estimates the costs of the production for green hydrogen at 16.50 €/kg.

Key Drivers of Hydrogen Production Costs

The main obstacle to the commercial success of green hydrogen is its cost compared to other sources of energy. Therefore, one of the most important questions is: How can we reduce

Production costs? To better understand this question and its implications, let’s take a deep dive into what contributes to hydrogen’s production costs.

The main elements defining its production costs are:

  • investment,
  • fixed operational costs,
  • variable operational costs and
  • utilisation.

By investment is meant all expenditure related to hardware incl. engineering and erecting – from electrolysis to piping and fencing. It is primarily impacted by the size and type of electrolysis. As large scale industrial production of electrolysis systems is still in its infancy, Fraunhofer’s IMS assumes that investment costs of electrolysis projects will be roughly cut to 50% of today’s cost level by 2030.

Fixed operational cost (OPEX) is primarily defined by labour and maintenance. Thus, the most probable scenario here are cost increases induced by general inflation effects. Besides, no significant cost changes can be anticipated.

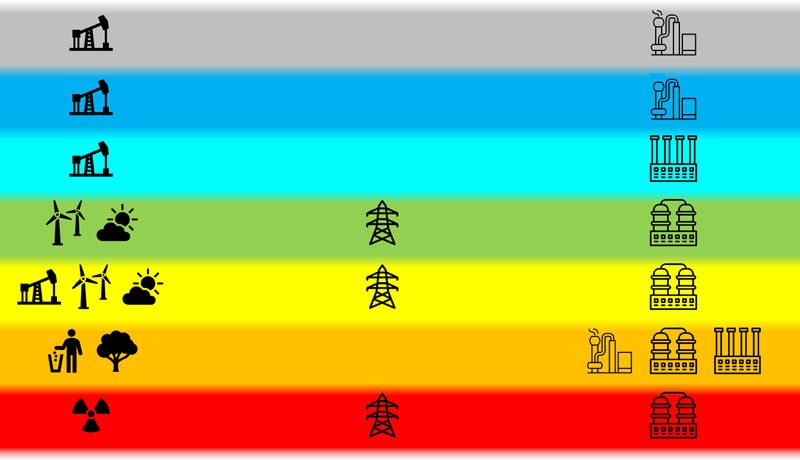
Variable OPEX is dominated by cost of electricity. Cost for water and other consumables which are required in minor quantities can be neglected for an initial estimation of production costs. Renewable electrical power can be generated for 0.03 to 0.17 €/kWh, depending on the utilized energy source and the size of the production facility.

The fourth factor influencing the hydrogen costing system is the utilization of the electrolysis. While variable OPEX is directly proportional to hydrogen production, investment costs and fixed OPEX are constant annual costs. Its impact on cost of production is depending on the overall hydrogen production and thus on capacity utilization. As producers generally try to increase utilization as much as possible, it directly depends on the availability of renewable electricity.

Dependencies in Cost of Production

Cost of production for green hydrogen can, slightly simplified, be calculated from these four factors and the time of depreciation, which is in many cases 10 years. The respective formula is:


CoP = V + (F + I / t) / (U * N)


CoP = cost of production [€/kg]

V = variable OPEX [€/kg]

F = fixed OPEX [€/a]

I = invest [€]

t = time of depreciation [a]

U = utilization [%]

N = nominal Production [kg/a]


As highlighted before, producers can primarily influence two factors: the cost of electricity, i.e. variable OPEX, and capacity utilization. Hydrogen production costs are reduced for lower electricity costs and increasing capacity utilization. Unfortunately, these two factors are not independent of each other for green hydrogen production.

In the example calculations shown in the table below, I assumed a 10 MW electrolysis with 65% efficiency, which would results in an annual hydrogen production of 1,500 t at 100% utilization. The overall investment cost is set at 10 M€ with a 10 years linear depreciation and 150 k€ annual fixed costs. For variable OPEX, only cost of electricity is included while all other costs are neglected for simplicity’s sake.

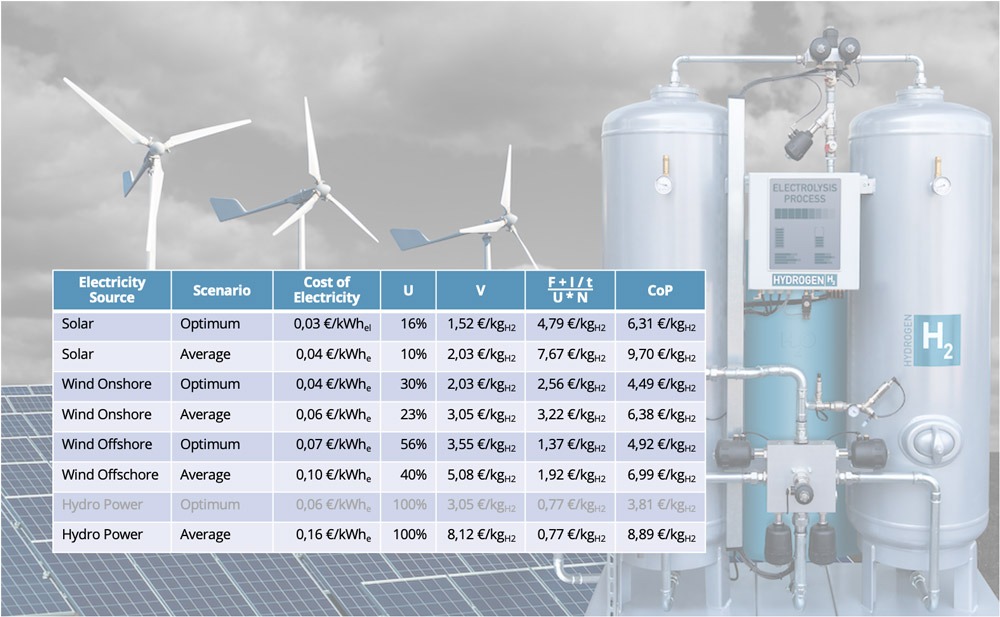
Bearing in mind that potential sites for large-scale hydropower plants are already used in Germany and thus the optimum scenario with a 10 MW hydropower station is unrealistic, the data showcase the reverse trend in variable and fixed elements in production costs.

Optimizing Cost of Production

Looking at the calculated cost of production, the key question is how to produce green hydrogen both ecologically and economically. One important factor will surely be e reduction in hardware cost. Even if a certain fraction of this effect will be balanced by inflation effects, the relative cost of electrolysis units will go down compared to other energy conversion technologies.

While investment costs for electrolysis technology can be expected to decline over time, a similar effect cannot be expected for wind and solar power. Thus, cost reduction for variable OPEX is rather unlikely, especially as sites with optimum wind and solar conditions will soon be utilized and new wind and solar parks will rather be built on B or C sites with lower average power production.

Finally, electrolysis utilization may be increased by use of power storage and a combination of several renewable electricity sources. Batteries or similar electricity storages can significantly increase utilization but are quite expensive as of today. Thus, an optimization of utilization comes at the cost of increased investments and the effect on hydrogen’s production costs are rather negative.

The approach to improve utilization by using several power sources, e.g. wind and solar power, seems to be more promising in reducing lower production costs. This scenario, however, requires an increased power supply which needs to be provided for. This may impact the average cost of electricity and thus has to be evaluated separately.

This example calculation and the discussion of its results highlight the complexity in green hydrogen economics. Contact us or follow us on LinkedIn to learn more about the topic.

Hydrogen (H), a colourless, odourless, tasteless, flammable gaseous substance that is the simplest member of the family of chemical elements.

Hydrogen is colourless – that is a well known fact and not only a definition from Encyclopædia Britannica, and yet, hydrogen is frequently referred to a having a specific colour. However, the colour coding does not define the actual optical appearance of the gas. Rather, it is used to indicate its ecological footprint and its carbon intensity in particular.

Occurrence and Production of Hydrogen

With more than 90% of all atoms and roughly 75% of matter, hydrogen is the most common chemical element in the universe. However, hydrogen only contributes to less than 1% of earth’s overall mass and hardly any terrestrial hydrogen is available as H2 but in more complex molecules like water or methane (i.e. natural gas), making it impossible to exploit natural hydrogen reservoirs on earth.

To make hydrogen available in large quantities one needs to split up molecules which are available in vast quantity. This is primarily done using three processes: steam reforming, methane pyrolysis, and electrolysis.

Today’s hydrogen production primarily relies on steam reforming. In steam reforming, a hydrocarbon – primarily methane – reacts with steam to hydrogen and carbon monoxide. In a subsequent process step, additional water is used to produce carbon dioxide and additional hydrogen from the carbon monoxide.

Another technology, methane pyrolysis, uses methane as starting point. The gas is thermally cracked into hydrogen and carbon. As carbon is a solid, it can easily be separated and stored or used in other processes, thus avoiding any carbon dioxide emissions to the atmosphere.

Perhaps the best-known process for hydrogen production probably is water electrolysis. As most terrestrial hydrogen can be found in water, this technology levers the largest hydrogen reservoir on earth. Electricity is used to split water into hydrogen and oxygen. As no carbonaceous molecules are involved in the process, it does not emit any carbon dioxide at all.

That is How Hydrogen Becomes Colourful

Hydrogen and its derivatives, i.e. energy carriers produced from hydrogen, are an important building block for a sustainable and climate neutral energy supply as no carbon dioxide is emitted when using hydrogen. For a sound evaluation of hydrogen’s climate impact, however, it is necessary to understand the way it is produced – and that is why its colour nomenclature makes sense.

The color of hydrogen determines both the primary hydrogen and energy carrier and the production process. This set of information allows for a rough estimation of the climate footprint of a specific batch of hydrogen and thus whether is can be considered climate friendly or not.

Unfortunately, different users are using different color codes which, in some details, differ from each other. We are following the definitions used by Germany’s National Hydrogen Council and the German Government.

Hydrogen produced from methane and other hydrocarbons using steam reforming is labeled as grey hydrogen. Assuming perfect process conditions, four hydrogen molecules and one carbon dioxide molecule are produced from one methane and two water molecules. The energetic efficiency of the process is at roughly 70%.

The carbon dioxide emissions from this process can be captured and permanently stored underground, either in gas caverns or suited geological formations. While the required process steps prevent emitting carbon dioxide in the atmosphere, they also reduce efficiency as additional energy is required for carbon sequestration and compression. Hydrogen produced by steam reforming from fossil hydrocarbons utilizing carbon capture is labeled as blue hydrogen.

Turquoise hydrogen is hydrogen produced by methane pyrolysis. As with grey and blue hydrogen, the production process utilizes fossil hydrocarbons. But since the byproduct is not carbon dioxide but solid carbon, carbon dioxide emissions are avoided if the energy required for the pyrolysis process is produced in a carbon neutral way. The technology is currently being developed but not yet commercially available at larger scale.

Red, yellow, and green hydrogen all stem from electricity using water electrolysis. There are no direct carbon dioxide emissions, and the energetic efficiency of commercial systems today is in the 60-65% ballpark. The different colors signify differnt sources of electricity.

Yellow hydrogen is hydrogen made from grid power. The energy mix, i.e. the percentage of fossil, nuclear, and renewable energy, is given by the power generation at the very moment the hydrogen is produced. The measure of carbon dioxide emissions of yellow hydrogen are varying because the energy mix is constantly changing – due to availability in solar and wind power and changes on the demand side. In case of a high percentage of coal and gas in the energy mix, the effective emissions of yellow hydrogen may temporarily even be worse than those of grey hydrogen.

In case only electricity from nuclear power plants is used for hydrogen production, this hydrogen is labeled as red. No carbon dioxide is emitted in its entire production process and thus it is climate neutral. However, nuclear power generation produces radioactive wastes which need to be securely stored for centuries. Thus, red hydrogen comes with additional risks.

Electrolysis utilizing only electricity from renewable sources, i.e. wind solar and hydro power, produces so-called green hydrogen. In the process, neither carbon dioxide nor any other harmful substances are produced. Unfortunately, the availability of renewable electricity is generally limited by weather conditions. Therefore, for a continuous production of green hydrogen, large scale batteries are required for storage of electricity.

Finally, orange hydrogen summarizes all production pathways utilizing waste or biomass as input. It is, however, impossible to have a general statement on overall efficiency and cabron bioxide emissions as this will vary depending on the input and the respectively used production technology.

You like to learn more about how to set up a sustainable and economical hydrogen supply? Contact us or follow us on LinkedIn for regular updates.