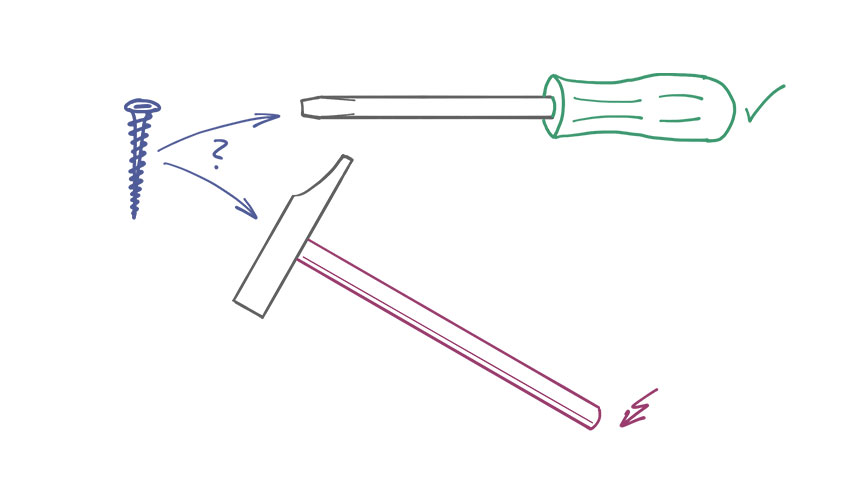
Management tools are a dime a dozen. And yet, contrary to popular belief, most of them are good and helpful if used correctly and in an adequately defined context.
In “Tool Box Talks” we introduce you to common and less well-known tools and show you how you can exploit their potential for your enterprise, with today’s focus on scenrio planning.
What is scenario planning and when should it be used?
Scenario planning is a strategic planning tool. It analyses the potential development of factors impacting the development of an organization and develops different pictures of its future. Thus, it allows for the development and the test of robust and adaptive stratgeties.
Whenever a company’s enviroment is characterized by ambiguity and frequent changes, scenario planning is a valuable extension in the strategic planning process. The tool’s strengths come into play whenever environmental factors impacting a company’s success are known but not the way they will evolve over time. In these circumstances, scenario planning helps to develop a realistic view on the future and derive strategies to achieve an organisation’s goals and objectives.

How is scenario planning used?
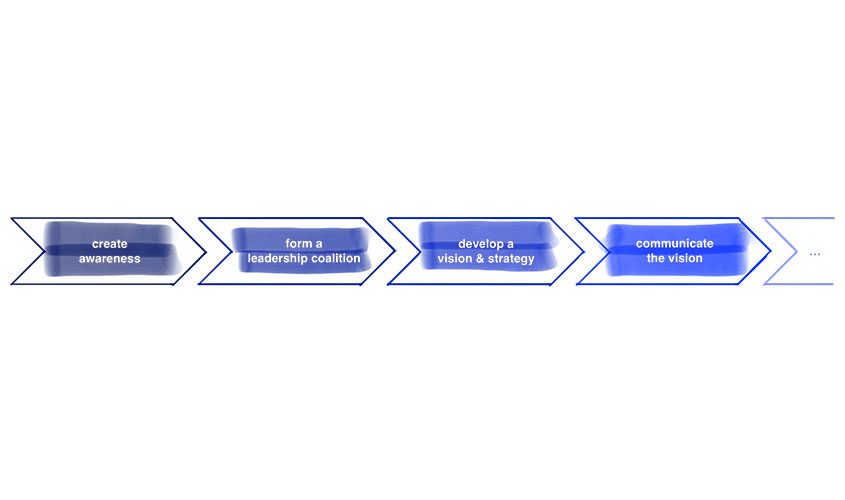
Scenario planning is a five-step process. First one needs to define the boundaries for the scenarios, i.e. the focus (e.g. a specific market, a region or country, a certain technology, etc.) and the time (e.g. the upcoming 12 months, the next 5 years, until 2050, etc.).
Next, the user needs to define the relevant impact parameter. If they are not already known, a PESTEL analysis is the tool of choice to ensure a holistic collection of impact factors. For each of the identified factors the user has to evaluate the potential future development. This should include the spread of potential outcomes as well as the accuracy of the prediction made. Finally, the impact of each factots on the defined targets and dependencies between different factors needs to be worked out.
The third step in the scenario planning process is the selection of scenario-defining parameters. These are characterized by (i) a high impact on the targets, (ii) a low predictability, and (iii) the absence of interdependencies. The number of scenarios is directly linked to the number of defining parameters: one parameter will lead to two scenarios, two parameters will result in four scenarios, three parameters can be used building eight scenarios and so on.
Once the defining parameters are selected, the user can formulate the final situation for each scenario by picking a set of extreme results from the defining parameters. These are used to depict a potential future at the end of the selected timeline. This should be as realistic and conclusive as possible and reflect all parameters identified in step two of the scenario planning process.
Finally, a narrative bridging the time between today and the future end points needs to be developed. As before, these stories need to be realistic, conclusive and meaningful for the organisation.

Beware of pitfall!
Scenario planning is not a prediction of the future. It rather highlights dependencies and helps making ambiguities tangible and handable. Thus, it is not the goal to develop the one correct scenario but rather a set of different, equally realistic ones.
As with planning in general, there is apotential danger that some initial impacting factors are unexplored or that the analysed data is biased. To overcome these obstacles, a wide range of people including externals should be involved in the scenario planning process.
Last, the development of a narrative may be tricky, too. The team needs to pay special attention to include all relevant impact parameters and use conclusive developments. Otherwise, the scenarios become blurry and are of little use for the organization.
What are the benefits of using scenario planning?
The primary result of the scenario planning process are the derived scenarios. These are the starting point for the development of robust strategies, i.e. strategies which allow the organization to achieve its goals and objectives independently of the future development. Besides, scenarios can be used to develop an early warning system. This enables the company to react to unfavourable developments early on rather than waiting for significant deviations in the results or to develop option-based strategies.
Another benefit from scenario planning is its systematic interaction with a company’s environmental factors. By frequently changing perspective from today’s boundary conditions to a potential furture development, the involved personnel develop a deeper understanding of how external factors impact the organization. This considerably improves the decision making process as external factors are more likely to be included.
Follow us on LinkedIn to learn on a regular basis how you can make the most of management tools, so that you will stay one step ahead of your competitors.