Management tools are a dime a dozen. And yet, contrary to popular belief, most of them are good and helpful if used correctly and in an adequately defined context.

In “Tool Box Talks” we introduce you to common and less well-known tools and show you how you can exploit their potential for your enterprise, with today’s focus on scenrio planning.
What is scenario planning and when should it be used?

Scenario planning is a strategic planning tool. It analyses the potential development of factors impacting the development of an organization and develops different pictures of its future. Thus, it allows for the development and the test of robust and adaptive stratgeties.

Whenever a company’s enviroment is characterized by ambiguity and frequent changes, scenario planning is a valuable extension in the strategic planning process. The tool’s strengths come into play whenever environmental factors impacting a company’s success are known but not the way they will evolve over time. In these circumstances, scenario planning helps to develop a realistic view on the future and derive strategies to achieve an organisation’s goals and objectives.

How is scenario planning used?

Scenario planning is a five-step process. First one needs to define the boundaries for the scenarios, i.e. the focus (e.g. a specific market, a region or country, a certain technology, etc.) and the time (e.g. the upcoming 12 months, the next 5 years, until 2050, etc.).

Next, the user needs to define the relevant impact parameter. If they are not already known, a PESTEL analysis is the tool of choice to ensure a holistic collection of impact factors. For each of the identified factors the user has to evaluate the potential future development. This should include the spread of potential outcomes as well as the accuracy of the prediction made. Finally, the impact of each factots on the defined targets and dependencies between different factors needs to be worked out.

The third step in the scenario planning process is the selection of scenario-defining parameters. These are characterized by (i) a high impact on the targets, (ii) a low predictability, and (iii) the absence of interdependencies. The number of scenarios is directly linked to the number of defining parameters: one parameter will lead to two scenarios, two parameters will result in four scenarios, three parameters can be used building eight scenarios and so on.

Once the defining parameters are selected, the user can formulate the final situation for each scenario by picking a set of extreme results from the defining parameters. These are used to depict a potential future at the end of the selected timeline. This should be as realistic and conclusive as possible and reflect all parameters identified in step two of the scenario planning process.

Finally, a narrative bridging the time between today and the future end points needs to be developed. As before, these stories need to be realistic, conclusive and meaningful for the organisation.

Beware of pitfall!

Scenario planning is not a prediction of the future. It rather highlights dependencies and helps making ambiguities tangible and handable. Thus, it is not the goal to develop the one correct scenario but rather a set of different, equally realistic ones.

As with planning in general, there is apotential danger that some initial impacting factors are unexplored or that the analysed data is biased. To overcome these obstacles, a wide range of people including externals should be involved in the scenario planning process.

Last, the development of a narrative may be tricky, too. The team needs to pay special attention to include all relevant impact parameters and use conclusive developments. Otherwise, the scenarios become blurry and are of little use for the organization.

What are the benefits of using scenario planning?

The primary result of the scenario planning process are the derived scenarios. These are the starting point for the development of robust strategies, i.e. strategies which allow the organization to achieve its goals and objectives independently of the future development. Besides, scenarios can be used to develop an early warning system. This enables the company to react to unfavourable developments early on rather than waiting for significant deviations in the results or to develop option-based strategies.

Another benefit from scenario planning is its systematic interaction with a company’s environmental factors. By frequently changing perspective from today’s boundary conditions to a potential furture development, the involved personnel develop a deeper understanding of how external factors impact the organization. This considerably improves the decision making process as external factors are more likely to be included.

Follow us on LinkedIn to learn on a regular basis how you can make the most of management tools, so that you will stay one step ahead of your competitors.

Management tools are a dime a dozen. And yet, contrary to popular belief, most of them are good and helpful if used correctly and in an adequately defined context.
In “Tool Box Talks” we introduce you to common and less well-known tools and show you how you can exploit their potential for your enterprise, with today’s focus on a PESTEL analysis.

What is a PESTEL analysis and when should it be used?

PESTEL analysis is a strategic planning tool. However, it is also used in strategic marketing or quality management. It analyses the external environment of an organisation and provides a holistic overview of external factors the organization should be aware of.
PESTEL analysis is the first of several steps in strategic planning activitities. Whenever external, macroscopic driving forces need to be considered in the planning process, PESTEL analysis is the tool of choice.

How is a PESTEL analysis used?

PESTEL is an acronym for:
P – political factors
E – economic factors
S – social factors
T – technical factors
E – environmental factors
L – legal factors
Conducting a PESTEL analysis requires several steps to be taken. First, the facilitator needs to select a goup of people representing as many different parts and functions of the organization as possible. This group brainstorms driving forces for each of the six topics.
Next, people external tot he organization are interviewed. This ensures that results are unbiased and helps broadening the background from which ideas are taken, thus reducing the risk of missing important factors in the analysis.
IN the next step, the identified driving forces are evaluated. To do so, all available data on each of the factors are collected and reviewed in order to identify the potential impact on the organisation’s objectives.
Finally, the list of driving forces is refined based on the previous data evaluation. The result is a list of relevant external factors for each of the six categories. This list is the input for subsequent process steps, e.g. a SWOT analysis.

Beware of pitfall!

While searching external driving forces, a PESTEL analysis focuses on six different topics to help create a holistic picture of the environment. In doing so, the tool forces the user to adopt different points of view on the environment. Though this aids to minimize bias effects it does not guarantee that the team will identify all relevant factors. Thus, while preparing for a PESTEL analysis, the group discussion leader needs to pay attention on the selection of participants – both the internals for step one and the externals involved in step two. The broader the experience and background of those involved, the higher the likelihood that all relevant driving forces will be captured.
The same is true for the data analysis in step three. In order to obtain reliable results, the team needs to ensure that inputs are not only taken from a few limited sources. Instead, they should try using a baseline as broad as possible in order to avoid biased data. Again, the use of external experts in data gathering and data evaluation may be helpful in generating a neutral and balanced data set.

What are the benefits of using a PESTEL analysis?

A PESTEL analysis generates an overview of factors potentially impacting an organization. In this way the results assist in better understanding the external context in which an organization is operating. This understanding is one of the key requirements when setting up a quality management system according ISO 9001. Results from a PESTEL analysis may also be used as in input for strategic planning like, for example, a scenario analysis.

Follow us on LinkedIn to learn on a regular basis how you can make the most of management tools, so that you will stay one step ahead of your competitors.
Management tools are a dime a dozen. And yet, contrary to popular belief, most of them are good and helpful if used correctly and in an adequately defined context.

In “Tool Box Talks” we introduce you to common and less well-known tools and show you how you can exploit their potential for your enterprise, with today’s focus on a portfolio matrix.

What is a portfolio matrix and when should it be used?

A portfolio matrix is a portfolio management tool that assists its user in keeping track of several projects within the project portfolio. By visualizing process adherence it enables the portfolio manager to identify critical projects at a glance.

This tool is particularly useful when it comes to coordinating a greater set of projects, where the portfolio manager is not identical with the project manager. It helps to gain an overarching view of the project portfolio and to focus resources on those projects whose success is currently under threat.

How is a portfolio matrix used?

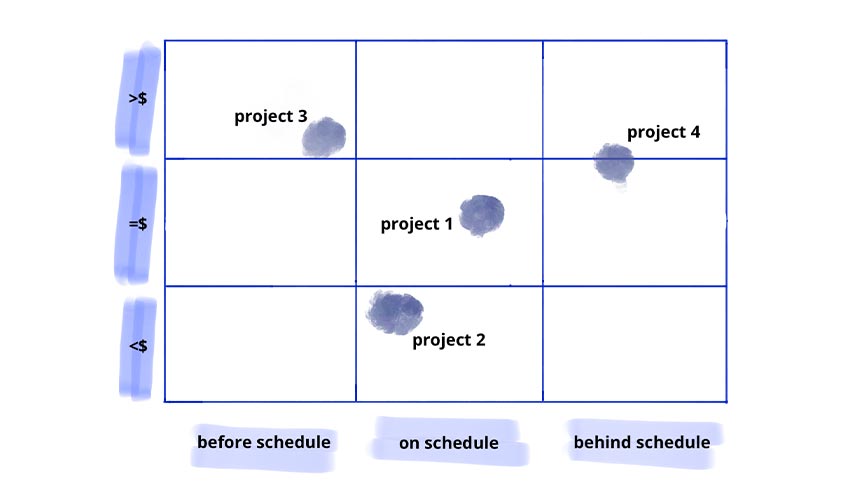
A portfolio matrix shows all portfolio projects’ target performances on process adherence, considering two dimensions for each project:

1.) How much does work progress deviate from original time schedules? (x-axis)

2.) How well is current spending within the frame of the pre-arranged budget? (y-axis)

If project portfolios are relatively small, these two dimensions can be visualised by means of a three-step scale (below plan – on plan – ahead of plan), if a portfolio comprises a greater number of projects, it makes sense to use a five-step scale (far below / well ahead of plan – slightly below / ahead of plan – on plan). Here standardized project reports should be used to update regularly the data input.

After each data update the respective project’s process adherence is plotted on the matrix. A project which is located in the middle of the matrix is exactly on schedule in terms of time and costs. The more a project diverges from the middle axis, the greater are the deviations from plan.

If this is the case, the responsible portfolio manager should take necessary measures to ensure process success.

Beware of pitfall!

A portfolio matrix is designed to show deviations from a project’s targets. However, a deviation is not necessarily to be seen as negative. For while it may sound so when a project exceeds the current target budget, there will probably be no reason for the portfolio manager to intervene if the project is ahead of schedule and the costs are in line with the reached project status. So before measures are taken, the deviations in the portfolio matrix should always be discussed in detail with the project manager.


Another trap is lacking awareness of priorities of projects. While the portfolio matrix informs about deviations from set targets, it does not make any statement about how relevant projects are within the portfolio. If you wish to make prioritization visible, a weighting factor can be introduced, which is reprresented by a colour code or the physical size of the projects within the matrix.

What are the benefits of using a portfolio matrix?

A portfolio matrix shows portfolio mangers at once what projects within the portfolio work out according to plan and where there are deviations from schedule. This will enable them to focus their attention on projects about to fail.


In this way, a portfolio matrix helps companies to use management resources effectively and to direct their focus on activities requiring extra attention.

Follow us on LinkedIn to learn on a regular basis how you can make the most of management tools, so that you will stay one step ahead of your competitors.
Management tools are a dime a dozen. And yet, contrary to popular belief, most of them are good and helpful if used correctly and in an adequately defined context.

In “Tool Box Talks” we introduce you to common and less well-known tools and show you how you can exploit their potential for your enterprise, with today’s focus on Porter’s Five Forces.

What is the five forces analysis and when should it be used?

Porter’s Five Forces Framework is one of the best-known models of strategic analysis. It analyses the external environment of a company and provides valuable input for strategic planning.

This tool is used for various strategic questions, the answers helping companies to optimise their strategies for the portfolio business with a special focus on external conditions, forming a sound basis for decision-making when it comes to entering new markets, or becoming a focal point to systematic innovation processes.

How is the five forces analysis used?

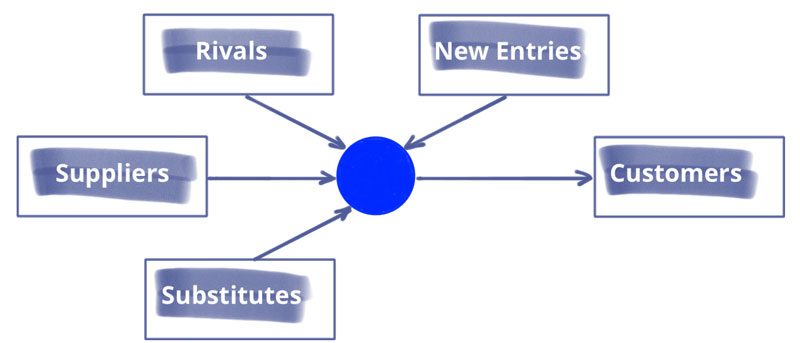
The five forces model, just as its name suggests, investigates five aspects of a company’s environment that have different effects on businesses:

  1. the bargaining power of suppliers
  2. the bargaining power of customers
  3. the jockeying for position among current competitors
  4. the threat of new entrants
  5. the threat of substitute products or services.

For each aspect the current market situation is being assessed: what is the present state of affairs? What changes are to be expected within the next years? What opportunities or threats will follow, affecting one’s own business? The last two questions could be used as a direct input to a SWAT analysis.

Having evaluated the current situation, different measures of strategic action can be analysed and assessed. What is important here is that both all five aspects of the five forces framework and identified developments plus interrelations are taken into account.

Beware of pitfall!

A common pitfall is a biased analysis. Established companies in particular which have long been present in a market or market segment tend to look at their market environment from entrenched positions. This will result in a distorted image of the status quo and a misjudgement of current developments.

To avoid this, it makes sense to use diverse sources of data for the analysis or to have more or less independent external service providers, like a business consultant, make the analysis.

What is the benefit of using the five forces analysis?

The five forces analysis provides a detailed description of a company’s external environment, which is a valuable input to strategy development. It makes it possible to tackle the questions of

  • how a company can best take advantage of its strengths and weaknesses,
  • what is necessary to stay successful in the market,
  • if an existing or a new market share is attractive for the company,
  • if it makes sense to focus on cost reduction or value enhancement,
  • etc.


Further, linking the five forces analysis with a scenario-based approach can lay the foundation for a company to apply dynamic strategic planning, thus enabling the enterprise to react to market change while it is happening or even to anticipate it.

Follow us on LinkedIn to learn on a regular basis how you can make the most of management tools, so that you will stay one step ahead of your competitors.

Management tools are a dime a dozen. And yet, contrary to popular belief, most of them are good and helpful if used correctly and in an adequately defined context.

In “Tool Box Talks” we introduce you to common and less well-known tools and show you how you can exploit their potential for your enterprise, with today’s focus on a decision matrix.

What is the use of a decision matrix and when should it be applied?

Whenever you have to choose from several options of action while trying to achieve several targets at once, a decision matrix will help you to make an objective choice.

When it comes to innovation projects, you often can choose from a range of paths to pursue. Seldom is it clear which of these options will lead to the best result. This is where a decision matrix can be helpful by being explicit about how individual targets are assessed and by ranking all available options in a way that makes sense.

How is a decision matrix used?

When a decision matrix is used to reach a decision, three steps are necessary:

  1. Defining the assessment criteria
  2. Evaluating all options on the basis of these criteria
  3. Choosing the best option following this assessment

To define the relevant assessment criteria, you make a list of all targets or requirements to be met. Make sure that the respective criteria are as independent as possible. Sometimes you may have to combine several similar criteria into a single one. For instance, “acquisition costs” and “operating expenses” can be subsumed under “life-cyle costs”. Should some of the criteria differ in relevance, they can be weighted by different factors counteracting this imbalance.

The second step is to go through each available option by applying these criteria one after the other. Experience has shown that a single 3-step rating system is sufficient (1 = hardly true / 2 = true / 3 = going beyond expectations). If weighting is used, the assessment results have to be multiplied by the respective weighting factor. Then the individual evaluation figures for each option have to be totalled.

Last, the results are put to discussion within the resolutions committee deciding with which option is to be chosen and what is to happen with the remaining options.

Beware of pitfall!

When using the decision matrix, you need to pay double attention: First and foremost, make sure the chosen assessment criteria are independent of each other; for if there is a correlation between several criteria, it is one and the same topical area that is being assessed, thus falsifying the final result. If such interdependencies cannot be avoided, an intelligent weighting can be a valuable remedy by equal weighting of, let’s say, financial, technical and logistical aspects.

Equally important is the process of decision making. As is true for all management tools, the decision matrix delivers more or less unambiguous results. However, it should never automatically trigger a decision. Every result has to be discussed and, particularly so when there are only slight differences between the different options or when the results go against expectations, they have to undergo critical examination.

Why use a decision matrix?

As has been said before, a decision matrix makes it possible to evualate all available options by comparing them with each other, visualising them and making them measurable. In this way this tool allows decision makers to have an open discussion about the pros and cons of each individual option, showing very clearly how suitable each option is for reaching the set targets.

Nevertheless, the decision matrix does not by itself arrive at a decision for or against an option. This has to be brought about by the responsible staff members within a company. Likewise, even the option rated highest can be voted down – on the basis of a decision matrix providing the relevant arguments.

Follow us on LinkedIn to learn on a regular basis how you can make the most of management tools, so that you will stay one step ahead of your competitors.
Management tools are a dime a dozen. And yet, contrary to popular belief, most of them are good and helpful if used correctly and in an adequately defined context.
In “Tool Box Talks” we introduce you to common and less well-known tools and show you how you can exploit their potential for your enterprise, with today’s focus on the Risk Matrix.

What is a risk matrix and when should it be used?

A risk matrix is a tool which helps you to deal with risks. This device visualises a risk assessment by taking account of its probability, its consequence severity and its level or priority.
To support risk managers in their work, risk matrices are often incorporated into risk registers, which they represent in a condensed and visualised form. Also, they have become customary in reporting, where they show the amount and distribution of risks in a project or in a specific operational unit

How do you use a risk matrix?

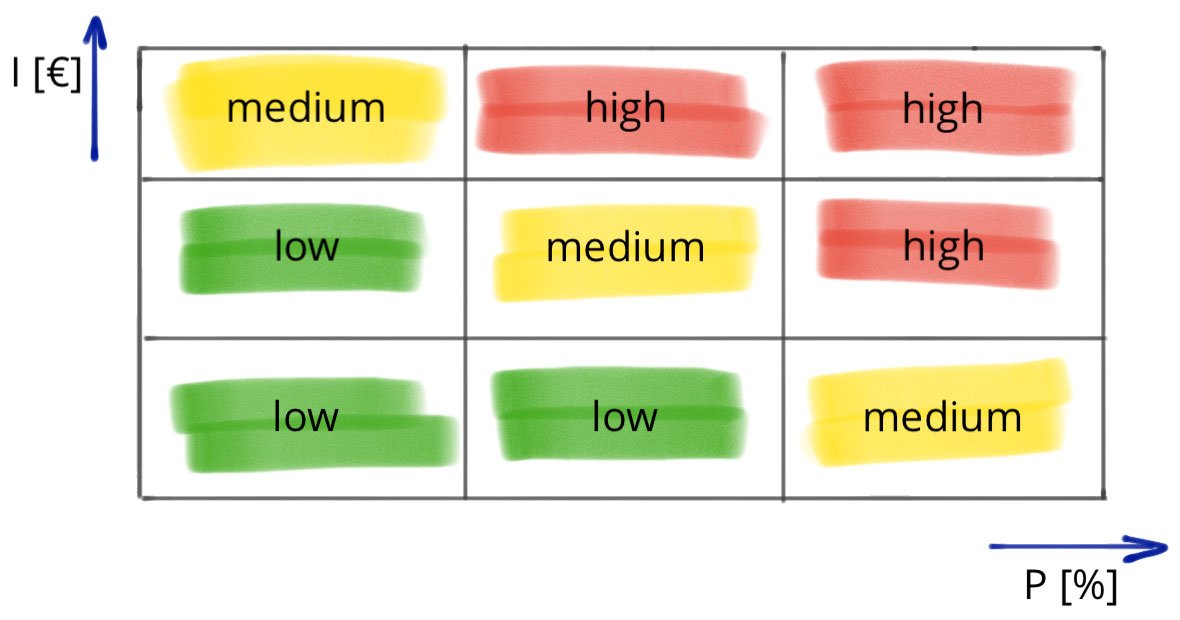
Before you can apply a risk matrix, you first have to identify and assess the risks for your project or your operational unit. Evaluating these risks works in three dimensions: probability, consequence severity and priority. The first two values can be assessed either qualitatively (high / medium / low) or quantitatively (in % or €), whereas the priority of risks is typically categorised into high / medium / low.
Depending on this assessment you then plot these risks on a two-dimensional matrix, with the x-axis representing the probability of occurrence and the y-axis corresponding to consequence severity. Priority can be visualised by the choice of different colours

Beware of pitfall

However, it is in particular due to this manner of visualising priorities that certain risks are neglected. The most frequent reaction to traffic light colours – the most often used colour for high / medium / low is red / yellow / green – is to focus on the red items by ignoring the green ones.
While it may certainly be right to prioritise some risks as ‘high’, classifying a risk as ‘low’ still does not necessarily mean that it “does not have to be dealt with actively”. So take a closer look at every single risk and double-check, no matter what the priorities, what measures you can take and which of them is suitable and should be put into action.

What is the use of a risk matrix?

A risk matrix is a tool to visualise all risks and their individual assessment. Thus it helps to quickly identify the most relevant risks – both in terms of their individual probability and consequence severity, and with regard to their priority.
This visualisation is particularly useful if you have to handle a great number of risks as it will make it easier for you to identify the most important issues at a glance and to tackle the most crucial ones first.
Furthermore, this form of graphical representation is ideal for reporting as this intelligent system of visualisation offers a valuable insight into the total number of risks and their criticality without the necessity to go through or analyse huge amounts of data.

Follow us on LinkedIn to learn on a regular basis how you can make the most of management tools, so that you will stay one step ahead of your competitors.
Management tools are a dime a dozen. And yet, contrary to popular belief, most of them are good and helpful if used correctly and in an adequately defined context.
In “Tool Box Talks” we introduce you to common and less well-known tools and show you how you can exploit their potential for your enterprise, with today’s focus on 5 why.

What is 5 whys and when should it be used?

5 whys is a quality management tool developed by Toyoda Sakichi. It helps to reveal causal links and to understand complex cause-and-effect relationships. This method is mostly used in root-cause analyses in the context of failure analyses or optimising processes. Apart from this, it is suitable for any kind of cause-and-effect relationship, particularly for linear ones with no or only few ramifications.

How is 5 whys used?

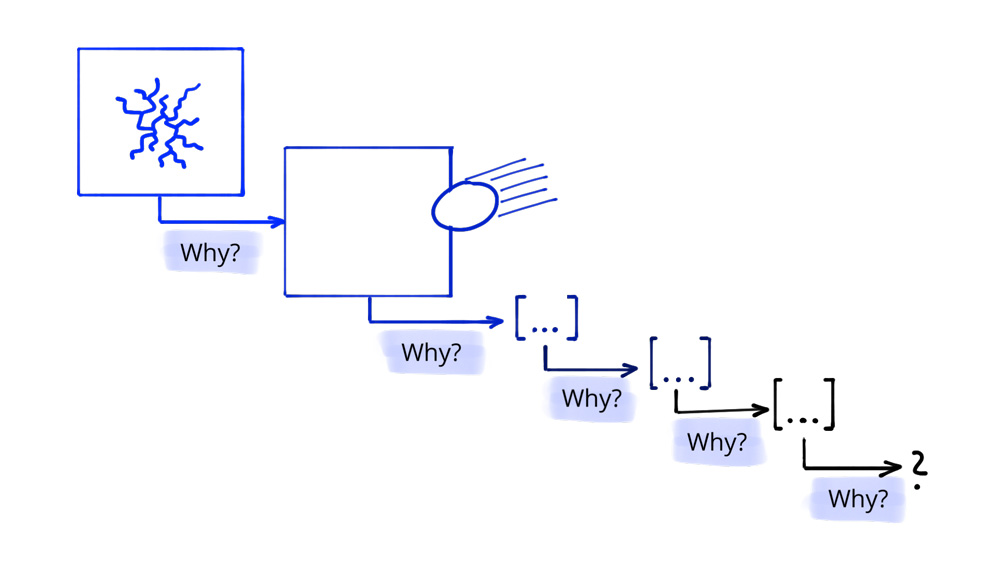
The starting point of a 5 why analysis is an observed deviation from the norm, i.e. the “effect”. This is where the first “Why?” is asked: “Why has the problem occurred?”
The answer to this question is the cause of the observed effect. This cause can again be understood as another effect of another cause, which is explored by means of a second “Why?”. This process is repeated five times until the cause of the cause of the cause of the cause of the observed deviation is discovered and its origin – its root cause – is detected.

Beware of pitfall

Make sure that, when using the 5 whys technique, that you do not only identify a possible cause-and-effect relationship, but also verify it, in a way that each of the “Why?” questions undergoes a process of examination checking if

  1. the shown causal link is possisble and plausible, and
  2. if under the present conditions the alleged cause is really responsible for the effect

Only if both requirements are fulfilled, the next “Why?” should be asked.
Besides, do not be a stickler with the number “5”. As a rule of thumb it is usually appropriate to ask for the cause five times to identify the actual source of a problem; still, you should check individually and flexibly if a sixth of seventh level might give you valuable information after all, or if you can end the process after the fourth question.

What is the use of the 5 why method?

A 5 why analysis brings to light the details of the cause-and-effect chain having led to the (mostly undesired) incident. This will help you to prevent this problem from occurring again.

Here a distinction is made between corrective and preventive measures. The latter are applied in the upper layer of the causal chain, thus addressing one specific issue, whereas preventive measures are used in the deeper levels of the cause-and-effect relationship – tackling the root cause. They usually have a greater, further-reaching impact, also making it possible to avoid other negative results originating from the same weakness.

Follow us on LinkedIn to learn on a regular basis how you can make the most of management tools, so that you will stay one step ahead of your competitors.
Management tools are a dime a dozen. And yet, contrary to popular belief, most of them are good and helpful if used correctly and in an adequately defined context.
In “Tool Box Talks” we introduce you to common and less well-known tools and show you how you can exploit their potential for your enterprise, with today’s focus on the Stakeholder Mapping.

What is the use of stakeholder mapping and when should they be applied?

Stakeholder mapping by means of assessment grids is an important tool for managing different groups of interest. It helps to subsume individual persons under predefined clusters, making it possible to deal and communicate with stakeholders effectively and appropriately.

Visualising stakeholders is particularly useful in project and change management processes, but also whenever different interests of various individuals and groups of persons have to be considered, for instance when it comes to strategic planning or preparing projects, events and workshops.

How do you create a stakeholder assessment grid?

To build an effective stakeholder assessment grid, you need to go through the following three steps:

  1. Identify the stakeholders
  2. Assess the stakeholders’ interests
  3. Rate the stakeholders’ influence.

First you need to make a list of all groups of interest that is as comprehensive as possible. These groups can include both individuals and bigger groups. Classifications into groups should only be carried out if they really share the same interests (e.g. team members of a specific department) or if, from the project’s perspective, they can be regarded as a unified entity (e.g. residents living next to a factory plant).

Having determined who your stakeholders are, you need to assess their level of interest in your project. Here a simple distinction between “interested” and “no interest” will be sufficient. A valuable additional piece of information to be added to your matrix as well is whether a stakeholder is supportive of or hostile to your goals.

Finally, you need to assess how much invidual groups of interest can impact whether or not your reach your goals. Here as elsewhere you should use the simple characteristics of “high level of impact” and “low level of impact” as the stakeholder mapping intends to provide a qualitative comparison and not a quantitative ranking.

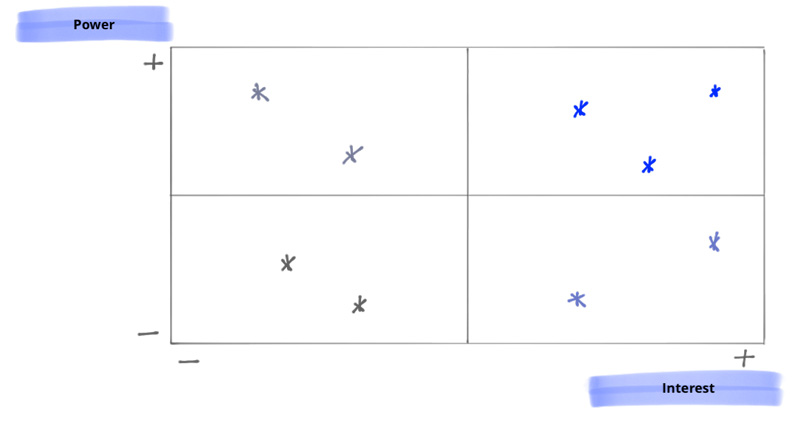
The assessment having been finished, the stakeholders can be plotted on a matrix, thus visualising their qualities relevant to the project in question. To do so, you build a two-dimensional assessment grid, with the x-axis representing the stakeholders’ impact. Their attitude towards the project’s aims can be additionally highlighted by a suitable colour (green = same goals; red = competing goals).

Beware of pitfall

Be careful when establishing different groups of interest. If too many people are classified as stakeholders, the grid will be confusing. To prevent this from happening, you should cluster people into groups. Make sure that the attributes you attribute to a group are really shared by all of its members. If in doubt, it is better not to categorise people into groups until you have assessed the relevant stakeholders individually.

Another trap you can fall into is if you overestimate a stakeholder’s real power. Here you need to distinguish clearly between somebody’s official position and their actual impact on the project. This is particularly true for change processes, where ordinary team members in key positions (so-called “key players”) can often impact an initiative to a much greater degree than many managers, even if these hold a much higher position in the company’s hierarchy.

What does a stakeholder assessment grid actually show?

A completed stakeholder interest-power grid shows you four groups of people and how you should deal with them if you want to reach your goals effectively and efficiently:

The first group, which has a high level of interest and considerable power, has to be actively managed. This set of people is crucial for whether or not you will achieve your goals.

You should equally keep an eye on stakeholders with a low degree of interest but high power. Make sure, with as little effort as possible, that they remain satisfied.

Those with a high level of interest but little power should be kept informed. The rest should stay on your mind – but, if possible, at very little or no expense.

Follow us on LinkedIn to learn on a regular basis how you can make the most of management tools, so that you will stay one step ahead of your competitors.
Management tools are a dime a dozen. And yet, contrary to popular belief, most of them are good and helpful if used correctly and in an adequately defined context.
In “Tool Box Talks” we introduce you to common and less well-known tools and show you how you can exploit their potential for your enterprise, with today’s focus on the PDCA-Cycle.

What is the PDCA Cycle and when should it be used?

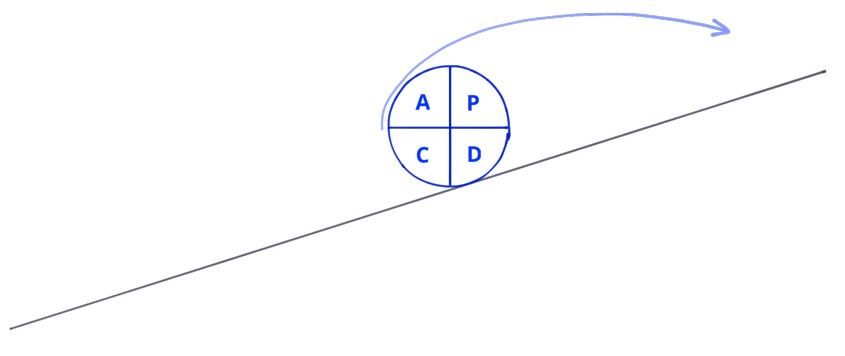
The PDCA Cycle, also called Deming Cycle or, after his inventor Walter A. Shewhart, Shewhart Cycle, is a process and quality improvement tool. It helps to systematically enhance internal procedures and practices by constantly checking in what way an adaptation of processes leads to different results.

The PDCA Cycle starts with the initial state of affairs, which is to be improved in a first step of improvement, with more to follow. This approach implies that processes are gradually improved and it unsuitable for designing processes from scratch or fundamentally changing them. What is more, the PDCA Cycle presupposes a cause-and-effect relationship between adapting processes and measurable changes of results. So before you apply this method, you should know well what the causal connections of the process in question are.

How is the PDCA Cycle used?

To reach a certain aim when using the PDCA Cycle to improve processes, you do this in four steps (cf. “How continuous improvement may succeed“):

  1. Plan
  2. Do
  3. Check
  4. Act

The first stage (“Plan”) defines what modification the process is to undergo and what will be the result expected from this adaption. The consequent implementation (“Do”) puts the planned measures into effect. If you use a special testing environment because, say, you want to protect running internal processes from unforeseen side-effects of your measure, you make sure that your testing environment diplays the real conditions in your company, so that you will be able to apply your insights to running processes.
In the third phase (“Check”) you compare the observed results of process adaptation with your expectations. Especially if the results do not match your predictions, you’ll have to find out why the measure diverges from your assumptions. Finally (“Act”) you update your knowledge about the relevant process and its documentation.

To reach the initially defined objective of optimisation, the PDCA Cycle is applied not once but several times until the final aim is reached, with each iteration gradually improving the process or the knowledge about it.

Avoiding the pitfall

Most customers find it easy to plan and implement an optimising measure. However, instead of checking the result (C), adapting the knowledge of the process (A) and planning a new strategy for improvement on this basis (P), in many cases the only response is a new set of activities – downgrading PDCA to PDR (plan-do-react).

The reasons for this behaviour range from a lack of measurable exptations to a loose work ethic. The result is always the same: The well-thought-out methodology of the PDCA Cycle is interrupted and rather than gradually improving processes, they fall victim to a blind testing of random measures. If processes should be improved despite the odds, they are so by mere accident, not by a systematic approach that follows clear guidelines. What you want to achieve, however, is a predictable and sustainable improvement.

What use does the PDCA Cycle have?

If used consistently, the PDCA Cycle will have a double benefit: for one thing, it ensures permanent gradual improvement of processes to which it is applied; for another, it leads to a precise understanding of the process and the way it relates to other internal processes as the current knowledge about the process is constantly reviewed and adapted if need be.

Follow us on Xing and LinkedIn to learn on a regular basis how you can make the most of management tools, so that you will stay one step ahead of your competitors.

Management tools are a dime a dozen. And yet, contrary to popular belief, most of them are good and helpful if used correctly and in an adequately defined context.
In “Tool Box Talks” we introduce you to common and less well-known tools and show you how you can exploit their potential for your enterprise, with today’s focus on the risk register.

What is a risk register and when should it be used?

The risk register is a risk management tool. Depending on the focus of the risk management activities, it documents risks related to a product, a project, a department or an entire enterprise. Though the tool stays the same for each of the perspectives mentioned, we strongly recommend having one independent risk register per perspective to avoid misinterpretation of the documented information (see “Do risk evaluations lead to faulty decisions?”).

A risk register should be used whenever risks need to be documented. The format of the risk register varies, depending on to the needs of the situation. An ad-hoc analysis, for example, generally requires less background information to be documented to be helpful than is needed for an extensive risk evaluation accompanying a complex and long running project. This difference in scope is reflected in the extent of the risk register. Besides the scope, the maturity of an organisation impacts the appearance of a risk register, which may be as simple as a spreadsheet or as complex as an integrated database using artificial intelligence for data completion and linking of information.

How is a risk register applied?

The simplest form of a risk register is a table listing all information required for risk management. The rows represent the individual risks while various pieces of information are organised in columns.
A basic set of risk information, i.e. columns in the risk register, are

  1. a continuous labelling for risk identification,
  2. an acurate description of the risk itself (i.e. what may happen and how does it affect the goals?)
  3. an estimation of the probability of occurrence,
  4. an evaluation of the impact and
  5. a proposal of a risk response.

There is much more information which may be included in a risk register, depending on the context.
Two approaches lend themselves as blueprints for adding information to a risk register in the context of a risk analysis. The most convenient one is working row by row, i.e. identifying one risk and then adding all related information before going on with the next risk. This approach follows intuition and thus is easy to facilitate. However, it also results in rather lengthy workshops and is therefore tiring. Alternatively, you may want to focus on the risk identification and description first and add all other information later. This approach shortens risk analysis workshops but also required a much more disciplined facilitation.

Beware of pitfall!

A risk register documents individual risks and their evaluation in a defined context. A common pitfall is to add up the individual risks and assume this number represents the overall product, project or organisational risk. Though this may be true in some rare instances, generally the actual product, project or organisational risk is significantly lower than the sum of the individual risks. The reason for this deviation between the overall risk and the sum of individual risks are dependencies between risks which are neglected if simply added up.

The transfer of risk information from one context to another is another topic to be aware of. Risk is defined as the “effect of uncertainty on objectives” (see ISO 31000:2018). Thus, if risks are transferred from one context to another, they need to be re-evaluated as generally the objectives shift with the context. Copy-paste of risk information from one risk register to risk register in a different context is simply wrong.

What is the use of a risk register?

A risk register summarises all information on risks within a defined context. Thus, it provides all data required for an effective risk management for the product, project or organisation. It also documents risk management-related activities by capturing changes in the evaluation of risks or decisions how to respond to risks. Therefore, the risk register allows for a detailed overview of risks and how they are managed.

Follow us on LinkedIn to learn on a regular basis how you can make the most of management tools, so that you will stay one step ahead of your competitors.